


One of the most complicated parts of a UX designer’s job is leveraging a wide array of quantitative and qualitative data and turning it into satisfying digital experiences. However, there comes a time when our designs need to be evaluated and crunched back into numbers to understand whether users find our products easy to use and whether our work satisfies the company’s business needs.
While turning research into design and turning it back into research is quite a leap, it’s safe to say that UX can be measured quite confidently. And despite a certain amount of imprecision associated with these transitions, the metrics businesses use to evaluate the quality of a design can provide everyone involved with a fair share of valuable insights.
Read on to find out more about the best ways to measure user experience and the kinds of metrics you should be focusing on when doing so.
Let’s dive right in.
What are UX metrics?
Fundamentally, the purpose of UX metrics is to establish whether a company’s attempts to improve the user experience of its product or service were successful and/or financially viable. These metrics can also be aligned with marketing KPIs to achieve a broader understanding of the impact created.
However, we recognize that this definition is rather dull, and it fails to take into account a critical element of a designer’s work—the user. Like anything in life, UX metrics have multiple perspectives as well.
A UX designer can learn a lot about users from UX metrics too. For instance, do users find the product helpful and easy to use? What are the parts of the user journey where users face the most friction? What can we do to make their experience better? These are but a few of the many things designers can learn about the quality of the experience they’ve created.
UX metrics can be both qualitative and quantitative, which allows the people involved to get a deeper understanding of the intricacies of how users interact with a product.
Why bother measuring
The critical question here is, “Why shouldn’t it be?”. UX specialists should seek to continuously improve their users’ interactions with the products they design—and meticulous measurement is key to understanding how that can be done.
Furthermore, by measuring user experience, designers can identify with a high level of precision what the most problematic areas are, enabling them to focus their efforts towards very specific improvements.
Kinds of metrics
There are two central categories of metrics that UX specialists can look at to identify potential improvements: attitudinal and behavioral.
Attitudinal metrics
These metrics revolve around how people feel or say about the product at hand. Typically, this kind of data is extracted via surveys, forms, or interviews—environments that allow people to express their opinions about their interaction with a particular design. Below, you’ll find two examples of attitudinal metrics.
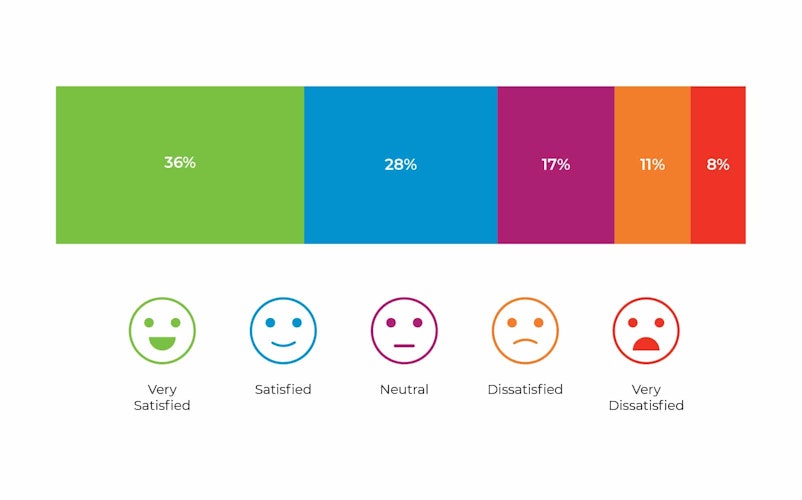
Metric 1: Customer satisfaction score (CSAT)
This is a fairly straightforward way of gauging how happy people are with your product. Typically, these assessments of customer satisfaction don’t come with a strictly-defined methodology. You can choose to do anything from asking a single question to creating a full-blown questionnaire. However, if you do choose to go with a more complex survey, consider planning how the respondents’ answers will be translated into percentages or scores.
While this metric won’t necessarily provide you with a user’s experience with a particular step of their journey, it allows everyone from designers and researchers to analysts and investors to get a broader understanding of how a product is performing.


Metric 2: Net promoter score (NPS)
The NPS was introduced back in 2003, and it has slowly but surely become a standard metric for businesses aiming to shift their focus towards their customers and enhance their experience with their product or service.
This is a fairly straightforward metric. Fundamentally, it consists of an 11-point rating (ranging from 0-10) that allows users to express the likelihood of suggesting the product at hand to their friends.
Businesses use this information to learn what the percentage of promoters is in their entire user base. Traditionally, a “promoter” is a person that selects 9 or 10. If you happen to choose 7 or 8, that will place you in the “passive” category, while selecting anything below 7 would make you a “detractor.”


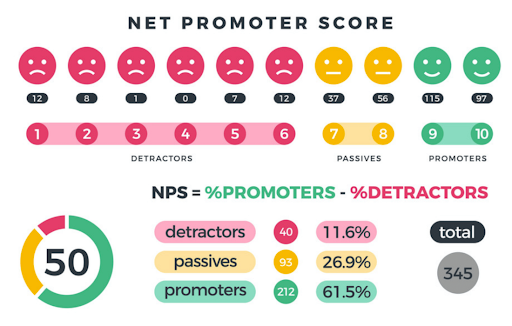
NPS allows organizations to gauge long-term customer loyalty, which is an incredibly important factor in the modern business ecosystem. Typically, products with large user bases can run NPS surveys once a month.
Behavioral
These metrics, on the other hand, analyze what users did and the specifics of their interaction with a product. However, it’s important to underline that these metrics are predominantly quantitative and provide a limited understanding of how people felt about their experience with a product, given the near-total lack of context. Below, you’ll find two examples of behavioral metrics.
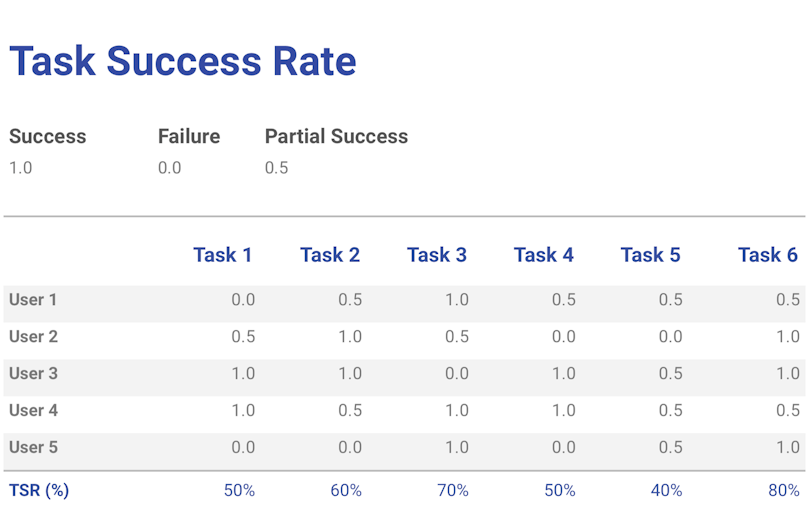
Metric 1: Task success rate
The task success rate is easily one of the most commonly used behavioral metrics used in user experience. Basically, it helps you understand the percentage of people that have successfully executed a task within a UI.
While this metric doesn’t really provide a lot of context as to why users have failed to perform a task, it provides UX specialists with a general understanding of the areas where users may be experiencing some usability issues.


Metric 2: Task on time
Task on time is another widely used behavioral metric that measures the amount of time it takes a user to execute a particular task. Organizations should start documenting task on time early in the development process in order to create a benchmark for further improvement. The logic is pretty straightforward here—the less time a person invests in doing something, the more usable and efficient a product is.
How to choose your metrics
The metrics above are but a few examples of what an organization can choose to measure. However, there’s a broad spectrum of choices businesses can make in this regard, and doing so can be overwhelming due to the sheer number of metrics available—which can make it hard to pinpoint the things that really matter.
To figure out what the most useful metric is for your product, you should take into account the following parameters.
The chosen metric should align with the key objectives
Start by establishing whether the metrics you’ve chosen align with a product’s primary business goal. Many companies focus on stuff like Lifetime Value to Customer Acquisition Cost ratio, Average Order Value, and so forth.
When choosing a key metric, always take into account your business’s priorities at this particular point—some are focused on boosting their revenue, while others are looking to increase their user count.
A good metric is actionable
A useful thing to take into account when defining your key metrics is actionability. Let’s put it this way—if a metric happens to trend downwards, it’s imperative to have a clear understanding of what you should do to counteract this downtrend. There is very little point in understanding that your ship is sinking if you haven’t planned the evacuation in advance.
A good metric is relevant
Often, metrics have a certain lifespan within an organization. Once introduced, an indicator will inform the organization about a wide array of relevant activities regarding the user base, revenue, growth, and so forth. However, as a product or service grows, its priorities shift as well, rendering this metric obsolete.
Therefore, when choosing a key metric, it’s important to focus on a product’s current needs and its near-immediate future.
It should be comparable to competitors' metrics
It’s always a good idea to choose a metric that will allow you to estimate your performance against your competition. This will enable you to strategize and plan operations, human resources, features, marketing, and a whole host of other essential facets of your business.
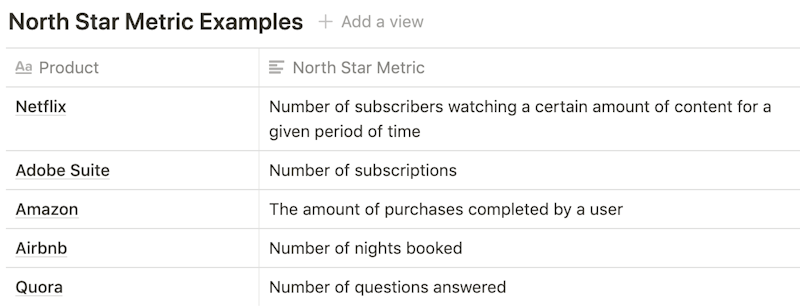
North Star Metric (NSM)
A North Star metric, as the name suggests, is a guiding indicator for a company—it’s used to gauge its long-term success and inform its strategy in the short term. An NSM must have three qualities: increase revenue, indicate customer value, and show progress.
Choosing the right NSM has been a defining factor for a wide array of businesses; Airbnb, Netflix, Uber, and Facebook are but a few examples. However, as we mentioned above, having the same NSM for too long can often cause a tunnel-visioned approach, which will most likely result in missed opportunities and a dwindling user experience.


The bottom line
UX metrics are essential for developing a truly useful and enjoyable product with an excellent user experience. These measurements allow designers to better understand and navigate user needs and the bottlenecks they face, enabling them to continuously improve a product over time.